
Portfolio
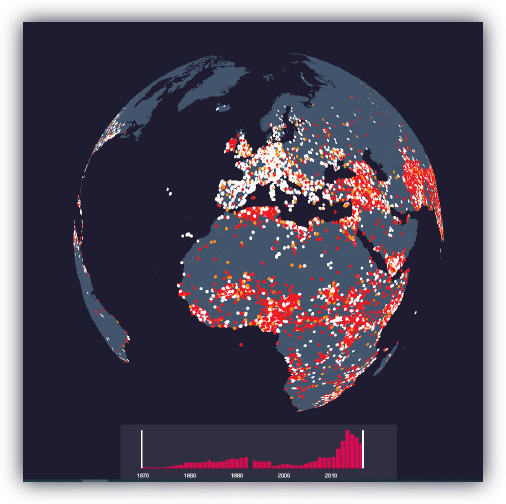
DATA VISUALIZATION: A History Of Terror
Description:
Global Terrorism has been a popular news item for over several decades. It’s a complex issue, that originates from various ideologies. With our globe tool, you can zoom in on terrorist attacks, filter attack types, discover the weapons that were used, see different timespans or even different terrorist organizations, and explore the world of terrorism for yourself.
Technologies:
R, JavaScript, D3.js, WebGL
DATA VISUALIZATION: Pension fund scrollytelling
Description:
A Dutch pension fund receives their yearly reports in a very long, very complex PDF issued format. My task was to simplify the core of the yearly important changes for the pension funds using their available data.
Technologies:
JavaScript, D3.js
DATA VISUALIZATION: Migration to the Netherlands
Migration to and from the Netherlands.
Description:
The Netherlands has a long history of immigration. Both refugees and economic migrants have come to the country in large numbers. Currently almost 20% of the Dutch population are immigrants or children of immigrant parents. This project was made with data from Statistic Netherlands (CBS).
Technologies:
JavaScript, D3.js
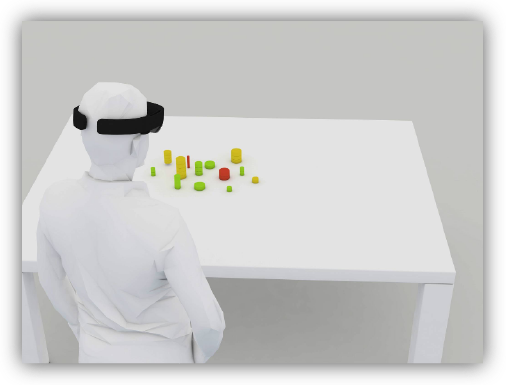
RENDER: Visualization beyound two dimensional displays
Description:
This is a 3D low polygon render for the Panoptes project. The Panoptes projects develops and evaluates several novel visualization approaches to help portfolio managers managing assets while considering carbon emissions in a more efficient way.
Technologies:
Cinema 4D
RENDER: AIS Trade Goods
Description:
This was a 3D low polygon render and background image for a project that visualizes the flow of goods to the Port of Rotterdam.
Technologies:
Cinema 4D